Objective: Establish the relationship between customer satisfaction feedback and observed measures of attributes related to network performance.
- Developed a Three Factor Structure Model to illustrate passengers have different expectations to different types of public transport attributes.
- Matched survey data with smartcard transaction to evaluate how the actual network performance would influence people’s satisfaction and identified the key performance metrics.
- Presented results at TRANSITDATA2020 in Toronto, helping transit operators to make investment strategies that improve passengers’ satisfaction with public transport.
Link to the presentation
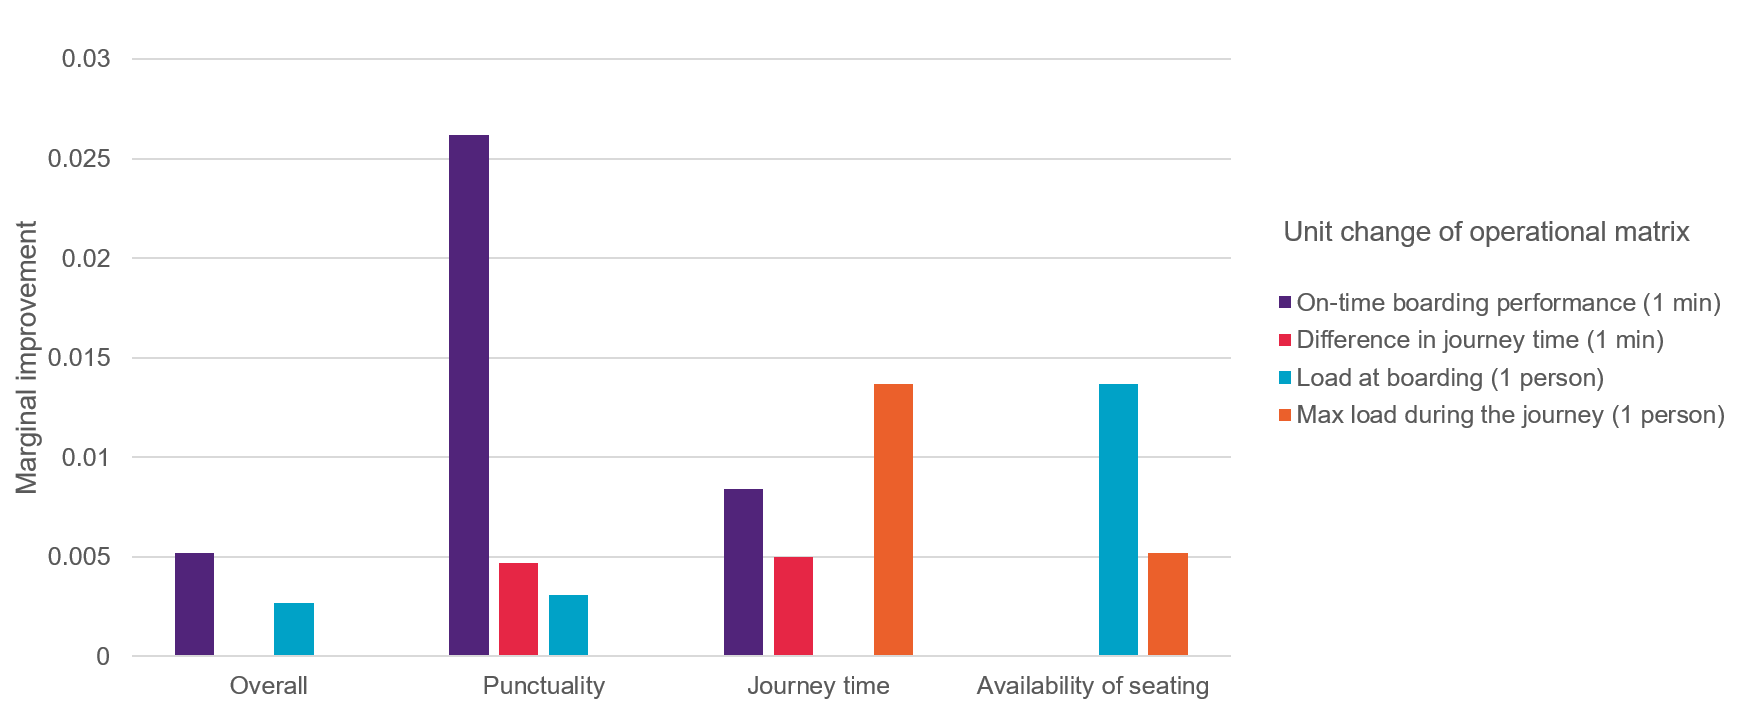 Figure 1: Marginal improments of objective service performance
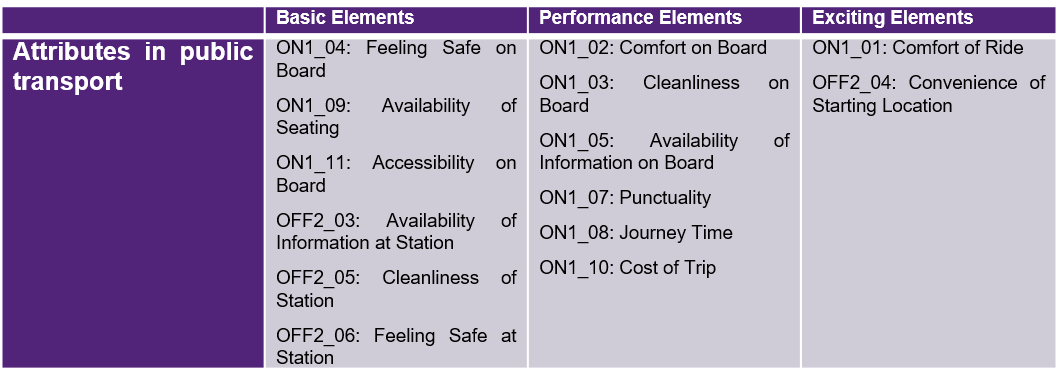 Figure 2: Public transport attributes catagorized by the passengers’ expectations, derived from the Three Factor Structure Model
Exploring Infrequent Use of Public Transport in Brisbane
Objective: Explore the travel patterns of infrequent users of public transport
- Processed the one-year smart card data in Brisbane.
- Clustered public transport users based on regularity and visualized the travel time and locations of infrequent public transport users.
- Presented results at TRANSITDATA2019 conference in Paris, helping in transit operators to develop demand responsive services for infrequent public transport users
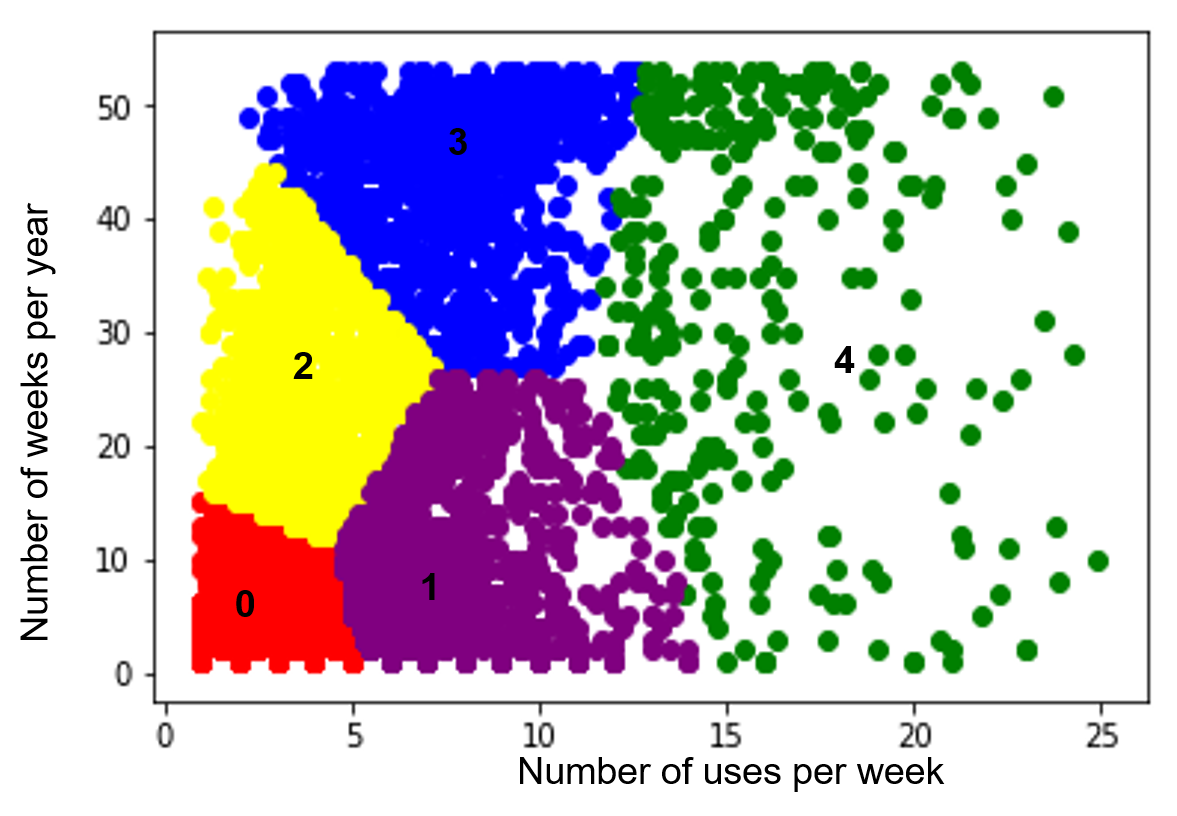 Figure 1: Clusters of users based on the frequency of using public transport
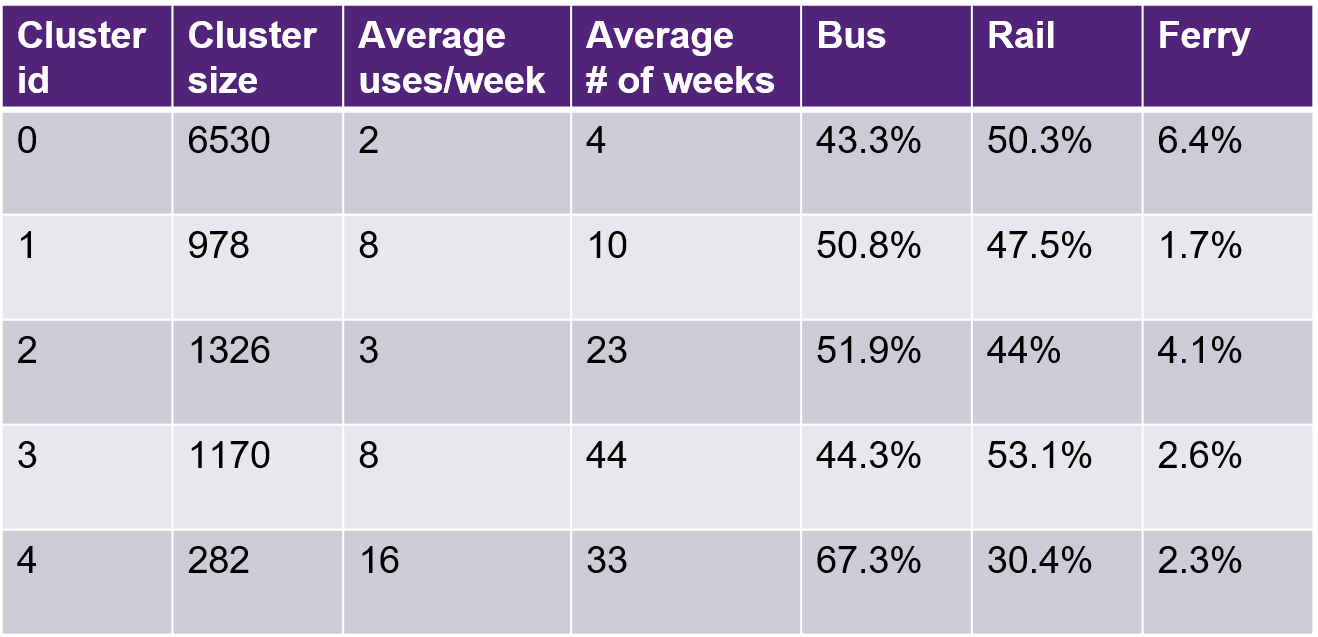 Figure 2: The distribution of travel modes of each cluster
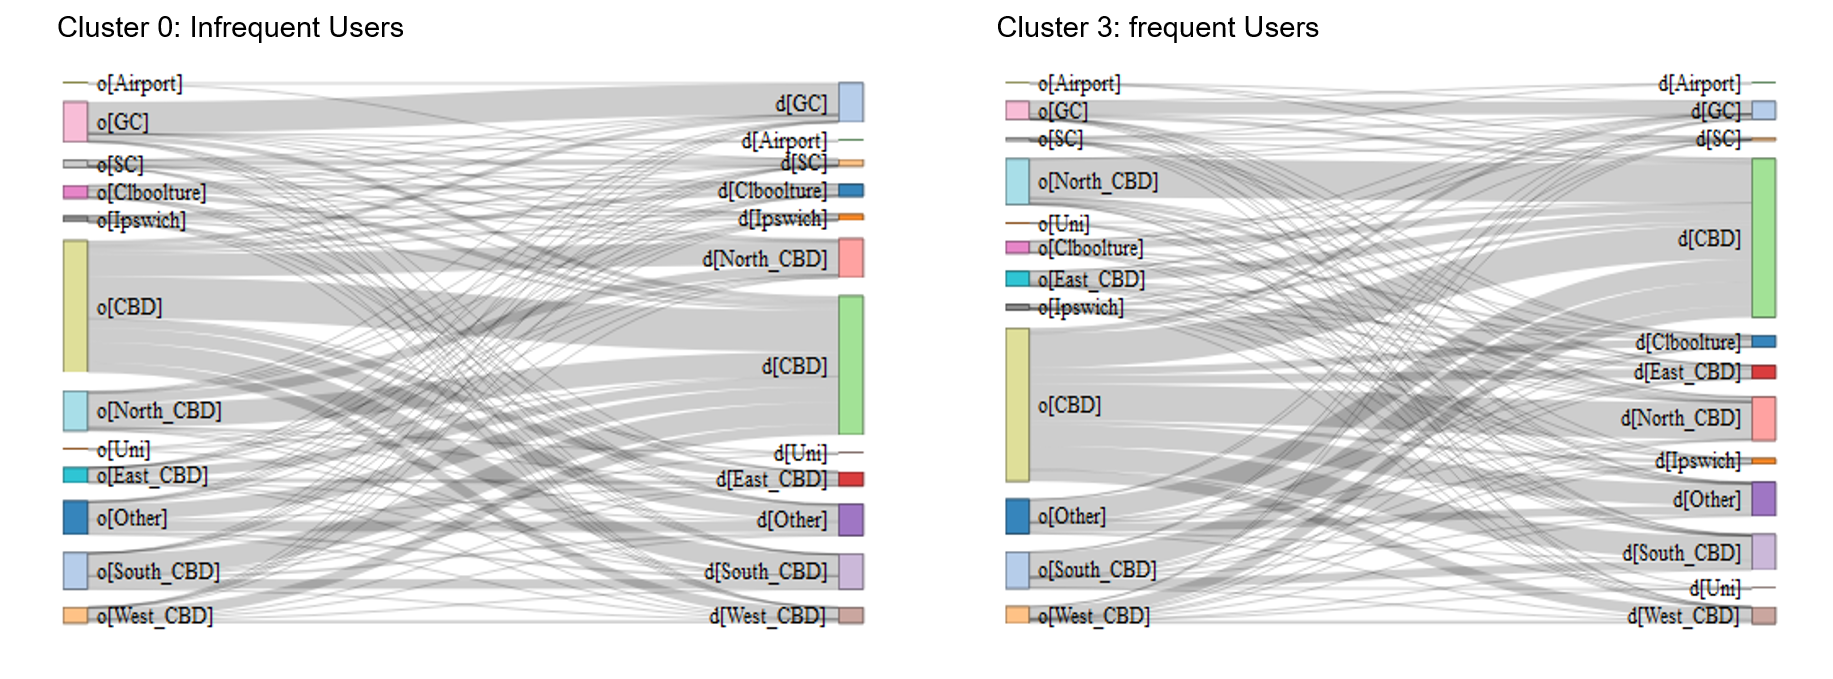 Figure 3: Comparison of spatial travel patterns for infrequent and frequent public transport users